Polkadot (DOT) is up 23% since June 10. BeInCrypto Analyst Valdrin Tahiri thinks that the uptrend may continue in the short term.
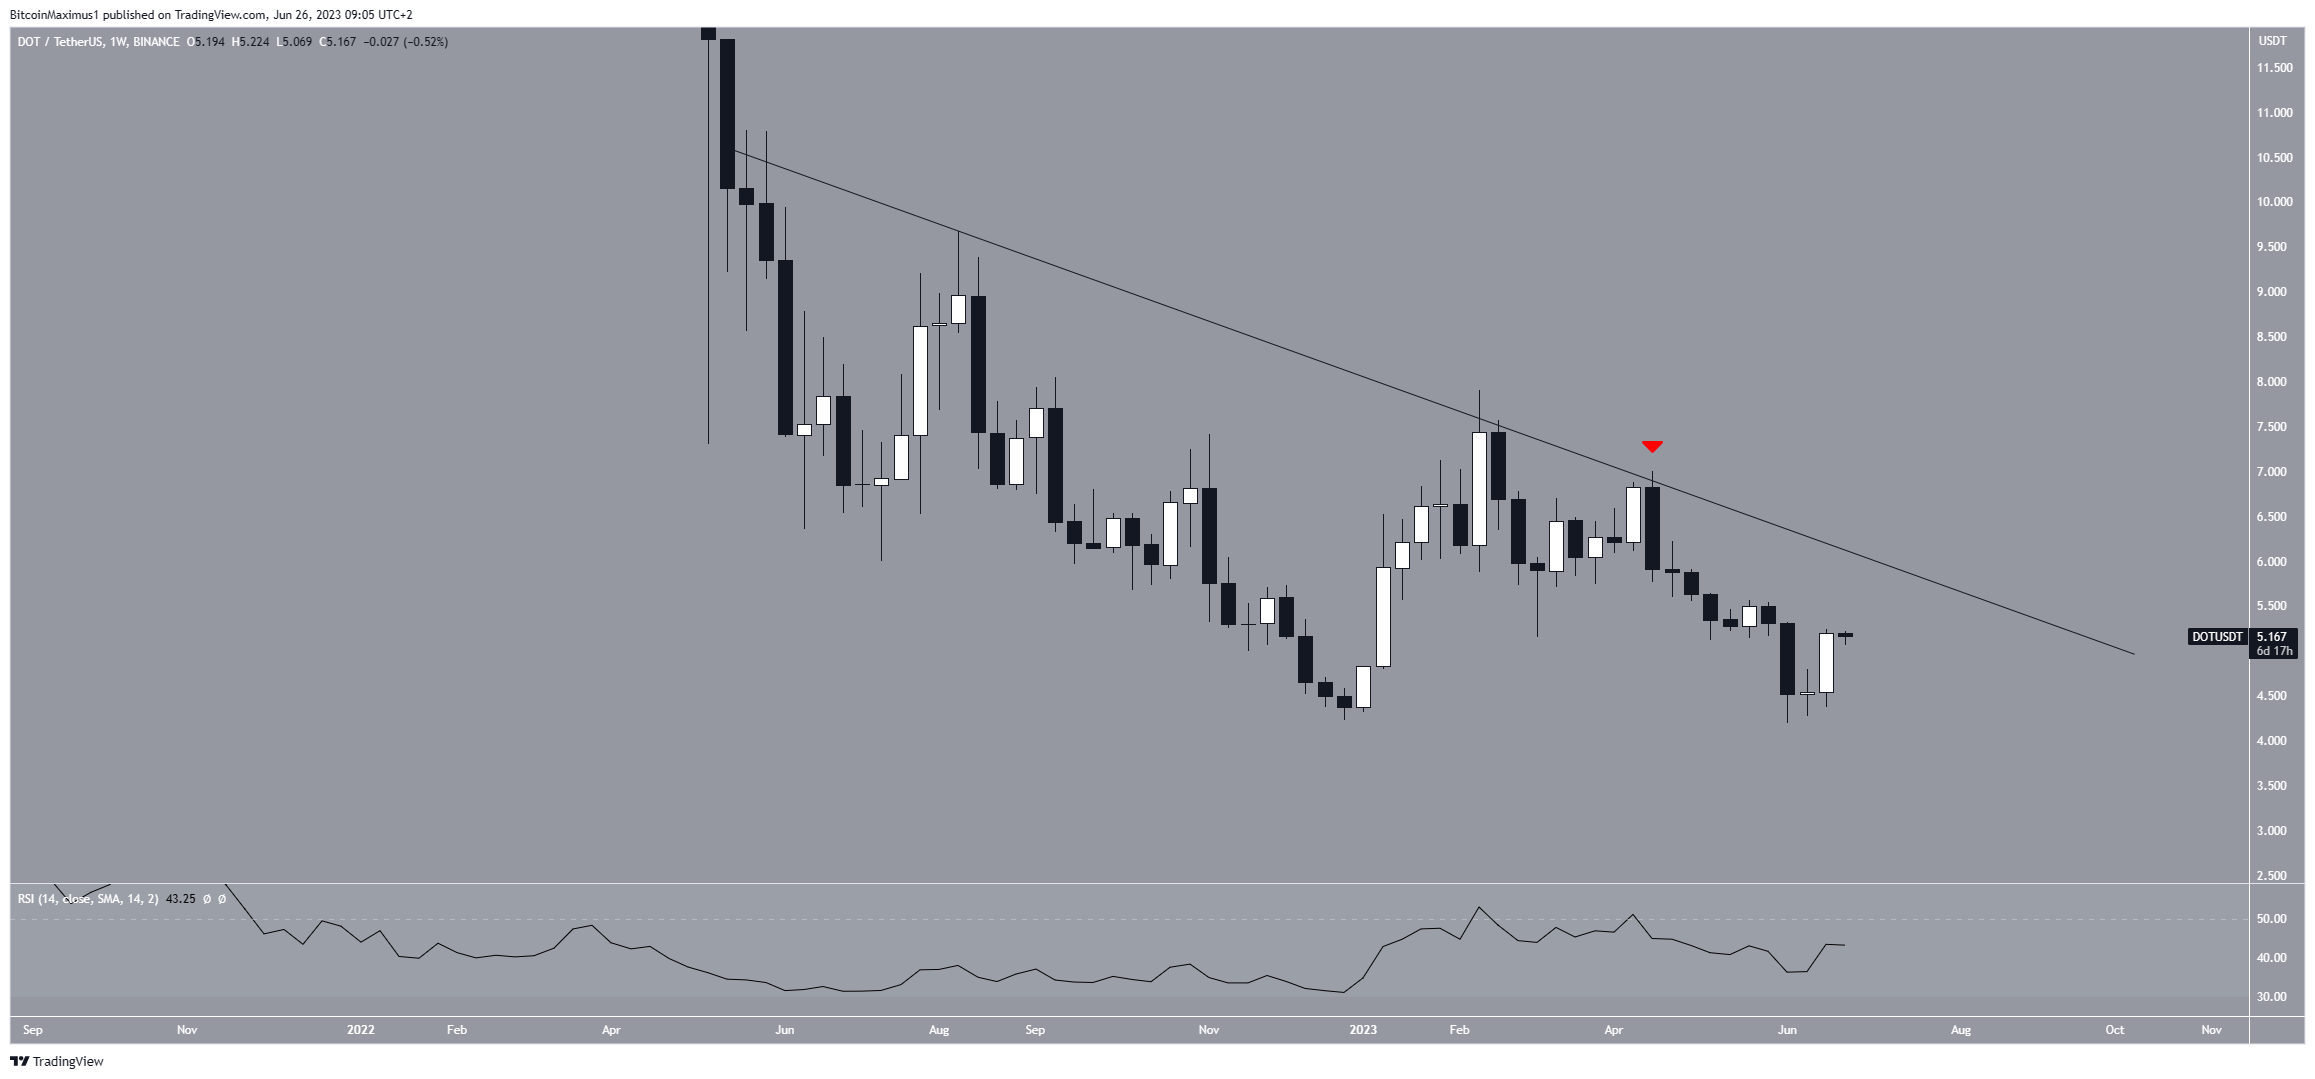
Polkadot price slumped below the descending resistance line for more than a year, falling as low as $4.20. Stating that there was a jump at this point, Valdrin states that a bullish engulfing candle was formed last week:
“Beside this candle, the DOT also formed a double bottom pattern and the price approached the resistance line. Although the weekly RSI is on the rise, it has not yet climbed above 50. This shows that the direction of the trend is still uncertain.”

Polkadot in the Short Term
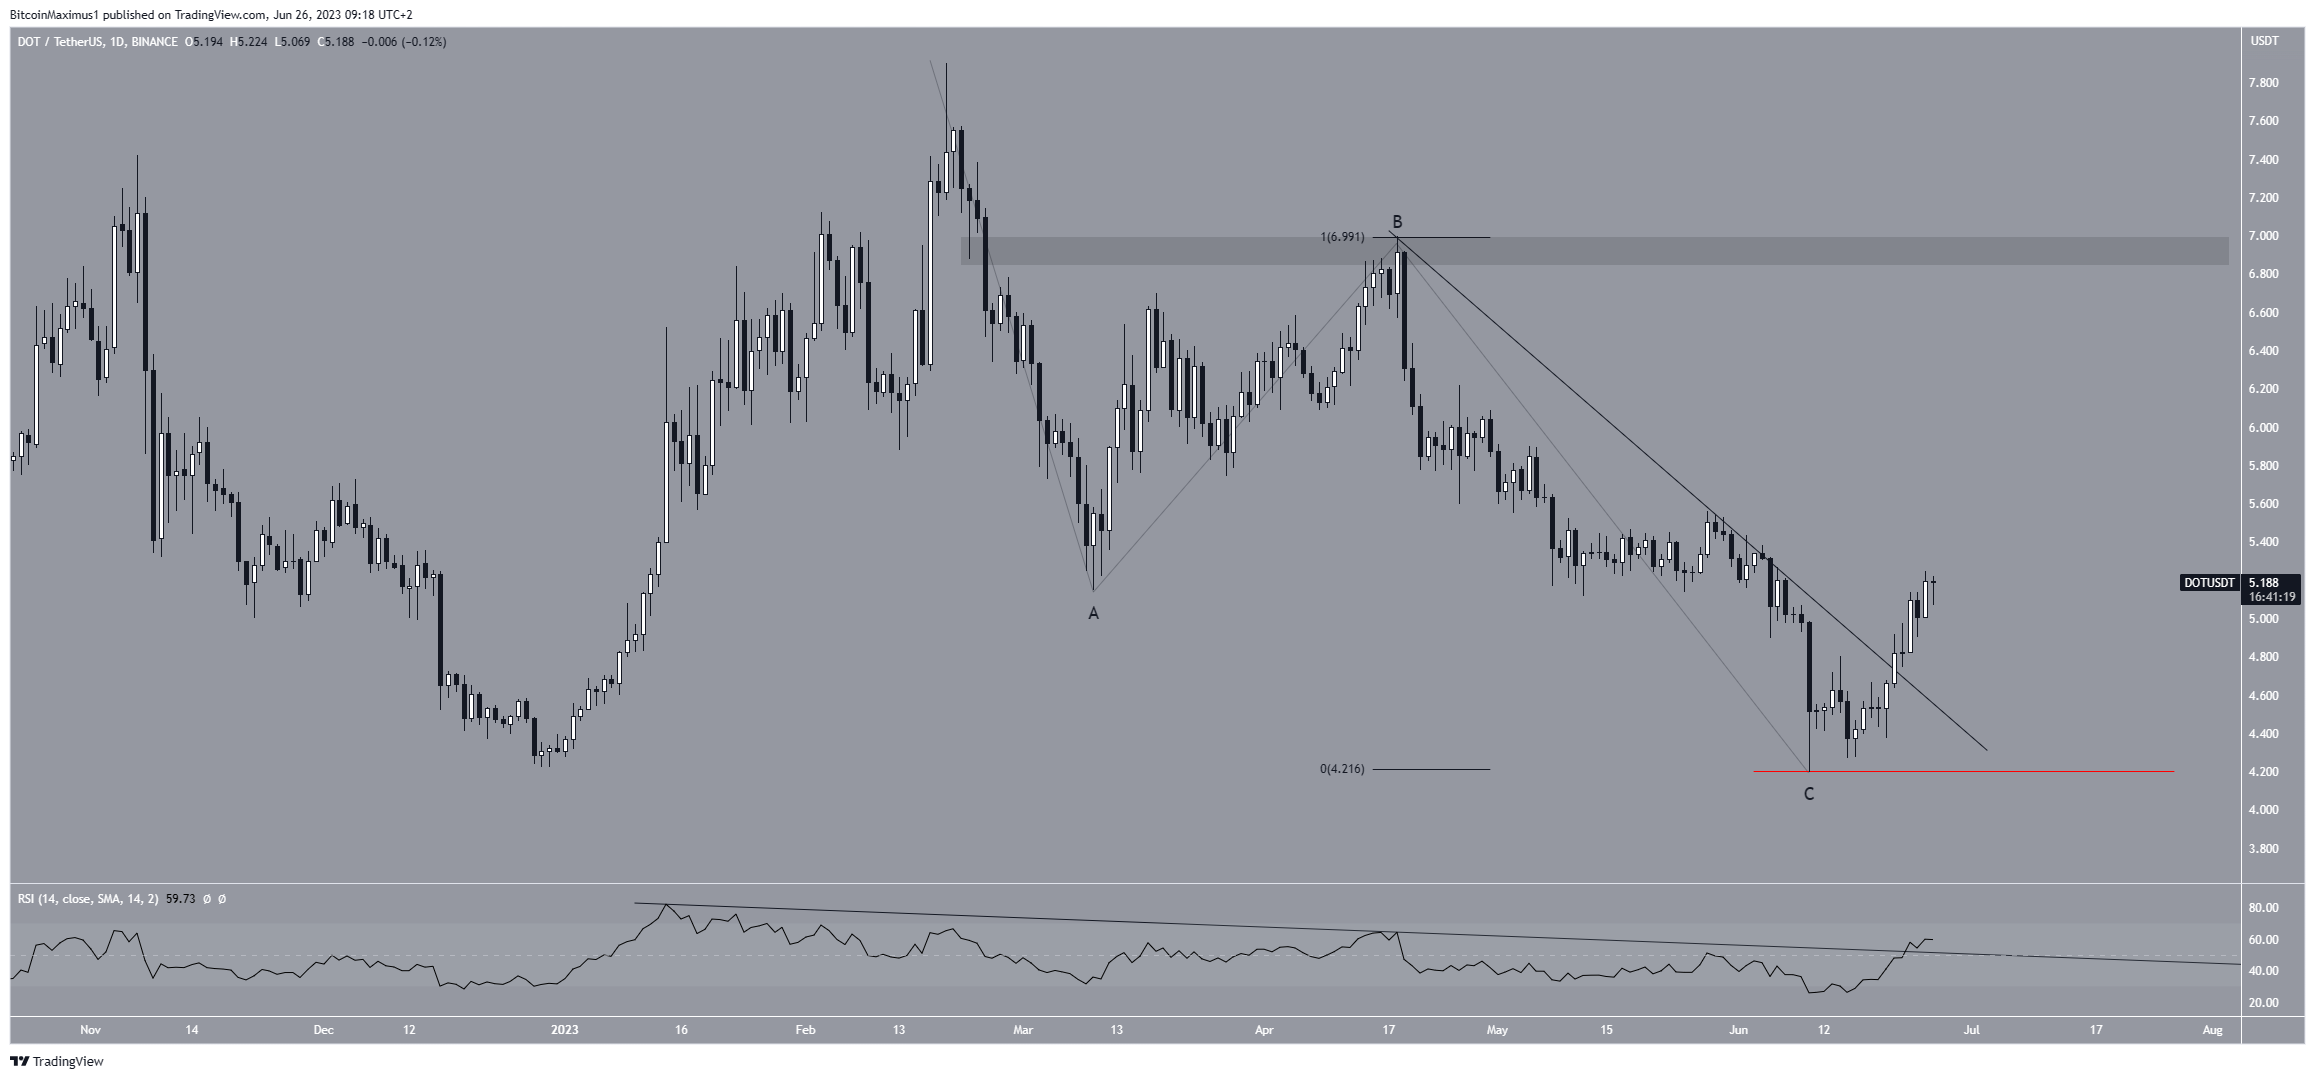
Valdrin thinks the daily chart offers a much more positive outlook than the weekly chart. According to the price action, RSI and Elliott wave theory, there may be an increase in the near future.
First, the analyst states that the DOT price broke the short-term descending resistance. Secondly, the RSI also broke its own resistance line:
“The break of the resistance indicates the completion of the correction. RSI’s movement is usually experienced before sharp rises.”
According to Elliott wave theory, DOT has declined within the ABC retracement structure after seeing $7.90. In this structure, the A:C waves also had a 1:1 ratio.
“All signs point to the end of the decline. I expect a rise to $6.90. Closes below $4.20 will invalidate the positive scenario. In this case, a decrease of up to 3 dollars can occur.”

Disclaimer
Disclaimer: In accordance with the Trust Project guidelines, this analysis paper is for informational purposes only. It should not be considered as investment advice. BeInCrypto is committed to providing accurate and unbiased reports, but market conditions can change quickly. It is always recommended that you do your own research and consult a professional before making any financial decisions.


